Why Executive Compensation Differs From Mid-Level Pay
Executive pay differs from mid-level pay because executives carry decision-making scope, market scarcity, and contractually negotiated packages that mid-level roles simply don’t. The gap isn’t just a bigger salary number. It’s a fundamentally different pay structure: more equity, more performance linkage, more custom contract terms, and more leverage at the negotiating table.
The components driving that gap include base salary, annual bonuses, long-term equity awards (RSUs, PSUs, stock options), deferred compensation, severance protections, and perquisites. Mid-level professionals typically get base salary plus a modest bonus. Executives get all of the above, with equity often representing the majority of their total package.
- Scope of responsibility is the single biggest structural driver.
- Market scarcity of proven executive talent pushes pay up through peer-group benchmarking.
- Governance mechanisms (compensation committees, proxy disclosure, say-on-pay votes) formalize the gap.
- Equity instruments create outsized wealth when stock prices rise.
- Custom contracts give executives severance, vesting acceleration, and deferred comp that mid-level offers rarely include.
Pro Tip: If you’re a mid-level professional preparing for a senior role, pull the proxy statement (Form DEF 14A) for any public company you’re targeting. It shows exactly what the named executive officers earn and how their pay is structured; that’s your negotiation benchmark.
Key Takeaways
Executive pay differs from mid-level pay primarily because of equity-based compensation, custom contract terms, and governance-driven benchmarking that mid-level roles don’t access by default.
| Point | Details |
|---|---|
| Equity drives the gap | At large-cap companies, base salary is less than 15% of CEO total direct compensation; equity is the majority. |
| Benchmarking escalates pay | Peer-group benchmarking at the 50th to 75th percentile creates a ratchet effect that raises executive pay across firms over time. |
| Structure matters more than raises | Moving into a role with equity and P&L authority typically closes the gap faster than negotiating within a salary band. |
| Mid-level wage growth is uneven | DOL/CTOT data shows $3.07/hour lower 10-year wage growth for Black entrants vs. comparable White entrants in mid-level occupations. |
| Resumewiz accelerates the transition | Executive resume writing, LinkedIn positioning, and negotiation coaching from Resumewiz help mid-level professionals move into equity-bearing roles with a stronger ask. |
Table of Contents
- What executive compensation actually includes
- Why executive compensation differs from mid-level pay: the core drivers
- How equity-based pay actually works and why it magnifies the gap
- How public vs. private company status changes pay design
- How big are the gaps and where to find the data
- What the pay gap means for your career and negotiation strategy
- Research spotlight: how organizational structure widens pay disparities
- What I’ve seen working with executives and mid-level professionals
- Resumewiz can help you position for equity-bearing roles
- Primary sources and where to verify the data
- Sources
What executive compensation actually includes
Executive compensation is a bundle of components, not just a salary. Understanding each piece is what lets you see where the dollar differences come from and why the gap between mid-level and executive pay widens so dramatically at large companies.
Base salary is the smallest piece of the executive puzzle at large public firms. According to Compensation Authority, base salary typically represents less than 15% of total direct compensation for large-cap CEOs. A mid-level manager, by contrast, often gets the majority of their total compensation in base salary.
Annual (short-term) bonus ties a percentage of salary to company or individual performance metrics, usually measured over one fiscal year. Executives may receive bonuses amounting to a multiple of their base salary, while mid-level bonuses, where they exist at all, tend to be a smaller percentage of base salary.
Long-term equity is where the real money lives at the executive level. The three most common instruments are:
- Restricted Stock Units (RSUs): shares granted outright, subject to a vesting schedule.
- Performance Stock Units (PSUs): shares earned only if the company hits specific financial targets.
- Stock options: the right to buy shares at a fixed price, profitable only if the stock rises above that price.
At S&P 500 companies, long-term equity awards are the majority of total direct compensation for CEOs. That single fact explains most of the executive pay disparity you see in headlines.
Deferred and nonqualified compensation lets executives defer income into future tax years, a benefit that doesn’t exist in standard mid-level packages. Severance and change-in-control provisions protect executives if they’re terminated or if the company is acquired. These can be worth one to three years of total compensation. Perquisites (company cars, club memberships, security, financial planning services) add value that rarely appears in mid-level offers.
Public companies must disclose all of this in their annual proxy statement under SEC Item 402, which requires tabular pay disclosure for Named Executive Officers. That transparency shapes how compensation committees behave and gives investors a direct line of sight into pay decisions. For mid-level professionals, it’s also the most reliable benchmarking tool available.
Pay mix comparison: A typical mid-level manager package allocates roughly 80 to 90% to base salary, 5 to 15% to annual bonus, and little to no equity. A large-cap CEO package might allocate 10 to 15% to base salary, 15 to 25% to annual bonus, and 60 to 75% to long-term equity. The structure, not just the total, is what changes.
Why executive compensation differs from mid-level pay: the core drivers
The pay gap between executives and mid-level professionals isn’t arbitrary. Several distinct mechanisms create and sustain it. Some are market-driven, some are structural, and some are purely contractual.
Firm size and complexity matter more than most people realize. A CEO running a $10 billion revenue company with 50,000 employees carries a fundamentally different risk and decision profile than a director managing a team of 12. NBER research on CEO compensation shows that firm size is one of the strongest predictors of executive pay levels, because the marginal value of a good (or bad) decision scales with the size of the enterprise.
Scope of decision-making and P&L responsibility are the role-level drivers. Executives own outcomes across entire business units or companies. Mid-level managers typically own a budget line and a team. Compensation committees price that accountability difference explicitly.
- Market scarcity and peer-group benchmarking create a ratchet effect. Companies hire compensation consultants to benchmark pay against a peer group, then typically target the 50th or 75th percentile of that group. Because every company does this simultaneously, the median keeps rising. This peer-group benchmarking dynamic is one of the most documented mechanisms behind escalating executive pay.
- Governance and disclosure formalize the gap. Compensation committees, composed of independent board members, set executive pay with input from outside consultants. Say-on-pay votes give shareholders a voice, but rarely reverse committee decisions. The entire process is documented in the proxy statement.
- Contractual and bargaining differences are where the gap gets locked in. Executive compensation is negotiated and custom-documented in individual contracts, while mid-level pay typically follows fixed salary bands with limited room to negotiate. Executives often hire legal and compensation advisors to secure severance protections, vesting acceleration, and nonqualified deferred compensation terms that simply don’t appear in standard offers.
- Organizational structure also blunts incentive pay for mid-level leaders. Research published in SAGE journals finds that division directors in large, diversified firms often receive smaller incentive pay than CEOs of smaller firms, because tighter monitoring and overlapping P&L responsibilities reduce the size of incentives. Where you sit in the hierarchy, and how many layers sit above you, directly affects how much performance pay you can access.
Retention premiums add another layer. When a company is competing to keep a high-performing executive, it often grants additional equity or accelerates vesting. Mid-level professionals rarely receive retention packages of comparable scale.
How equity-based pay actually works and why it magnifies the gap
Equity is the mechanism that turns a high executive salary into generational wealth. Understanding how it works is the first step toward negotiating for it yourself.
RSUs (Restricted Stock Units) are the most common form at large public companies. You receive a grant of shares that vest over time, typically over three or four years. On each vesting date, you receive shares (or their cash equivalent) regardless of whether the stock price has moved. The risk is low; the upside is tied directly to stock performance.
PSUs (Performance Stock Units) add a performance condition. You earn shares only if the company hits specific targets, often total shareholder return relative to a peer group, or earnings per share growth. Miss the target, and you receive fewer shares or none at all.
Stock options give you the right to buy shares at a fixed price (the strike price) set at the grant date. If the stock rises above that price, the difference is your gain. If it doesn’t, the options expire worthless. Options create high leverage but also high risk.
Vesting schedules control when you actually receive the value. Cliff vesting means you receive nothing until a specific date, then everything at once. Performance vesting ties the release to hitting metrics.
The compounding effect is what creates the gap. An executive who receives annual equity grants over a decade, with each grant vesting over three to four years, holds multiple overlapping grant cycles simultaneously. When the stock rises, all of those grants appreciate at once. A mid-level professional with no equity participation misses that entire wealth-building mechanism.
Liquidity timing matters too. At public companies, RSUs and PSUs convert to tradeable shares on vesting. At private companies, equity has no market until a liquidity event (an IPO, acquisition, or secondary sale). That uncertainty is real, and it affects how you should value a private-company equity offer.
Pro Tip: When you receive an equity grant notice, ask HR four specific questions: What is the vesting schedule? Is there accelerated vesting on a change of control? What happens to unvested shares if you’re terminated without cause? And what is the current 409A valuation (for private companies) or the grant-date fair value (for public companies)? Those answers tell you what the grant is actually worth.
How public vs. private company status changes pay design
Company type shapes compensation structure more than most professionals expect. The differences go beyond disclosure rules into how pay is designed, when you can access it, and how much negotiating leverage you actually have.
Public companies operate under SEC disclosure requirements that make executive pay fully visible. Proxy statements (Form DEF 14A) show base salary, bonus, equity grants, and total compensation for Named Executive Officers. Compensation committees use formal peer-group benchmarking, and pay-for-performance frameworks are standard. RSUs and PSUs dominate long-term incentive design because shares are liquid the moment they vest.
Private companies, including PE-backed firms, have far less public disclosure. Long-term incentives often take the form of cash-based long-term incentive plans (LTIPs), profits interests (for partnerships and LLCs), or option pools tied to an eventual exit. The upside can be substantial, but it’s illiquid until a transaction occurs. PE-owned companies often use management carve-outs or co-investment structures that create significant executive wealth at exit, but those instruments are opaque and highly negotiated.
Startups occupy a different category. Early-stage equity (common stock options or ISOs) can be worth very little or a great deal depending on the outcome. The vesting schedules are similar to public companies, but the liquidity timeline is entirely uncertain.
| Dimension | Public company | Private / PE-owned company |
|---|---|---|
| Pay disclosure | SEC proxy (Form DEF 14A), fully public | Limited; no public filing required |
| Long-term incentive type | RSUs, PSUs, stock options | Cash LTIPs, profits interests, option pools |
| Liquidity timing | Shares tradeable on vesting | Requires IPO, acquisition, or secondary sale |
| Benchmarking | Formal peer-group process, consultant-driven | Less formal; often negotiated directly |
| Performance linkage | Explicit metrics in PSU/bonus plans | Often tied to EBITDA targets or exit multiples |
For mid-level professionals, the practical implication is this: equity at a public company is predictable and liquid. Equity at a private company may be worth more, but you’re taking on timing and liquidity risk. Understand which type you’re negotiating for before you assign a value to it.
How big are the gaps and where to find the data
The scale of executive pay disparities is well-documented, but the numbers vary significantly depending on what you measure and how.
EPI’s analysis of CEO pay documents the dramatic rise in CEO compensation relative to typical workers over recent decades. The CEO-to-worker pay ratio at large U.S. firms has grown substantially since the 1970s, driven almost entirely by equity-based compensation. EPI’s methodology uses realized compensation (what executives actually received in a given year, including exercised options and vested equity) rather than granted compensation, which produces higher and more volatile figures.
FRED’s compensation data categories provide time-series context for macro wage trends, useful for cross-checking whether executive pay growth tracks or diverges from broader compensation trends. Spoiler: it diverges, sharply, at the top.
The volatility point is worth understanding. Because equity drives most executive total compensation, CEO pay figures can swing dramatically from year to year based on stock performance, even when base salary stays flat. A CEO whose RSUs vested in a strong market year will show far higher realized compensation than in a flat year. That volatility makes single-year comparisons misleading.
| Primary source | What it measures | How to use it |
|---|---|---|
| SEC proxy (Form DEF 14A) | Individual executive pay at public companies | Search EDGAR for any public company; find the Summary Compensation Table |
| EPI CEO pay analysis | CEO-to-worker ratio trends, methodology notes | Use for historical trend context and ratio interpretation |
| FRED compensation series | Macro wage and compensation indexes over time | Cross-check executive pay growth against broader wage trends |
| DOL/CTOT study | Mid-level wage growth by occupation, gender, race | Understand career-path wage dynamics for non-executive roles |
| Academic journals (SAGE, Oxford Economic Papers) | Structural and governance drivers of pay | Understand mechanisms, not just magnitudes |
Reading CEO-to-worker ratios requires care. The ratio depends heavily on whether you use median worker pay or average worker pay, whether you include part-time workers, and whether you use granted or realized executive compensation. Companies are required to disclose their CEO pay ratio under SEC rules (adopted under Dodd-Frank), but methodologies vary enough that cross-company comparisons need scrutiny.
What the pay gap means for your career and negotiation strategy
Understanding why executive compensation differs from mid-level pay is useful. Knowing what to do about it is better. Here’s a structured approach.
Negotiation checklist for mid-level professionals moving toward senior roles:
- Ask for equity at every offer stage. Even if the initial offer doesn’t include equity, ask. Many companies have discretionary grant pools that managers can access if asked.
- Clarify vesting terms before you sign. Cliff vs. graded vesting, acceleration on change of control, and treatment of unvested shares on termination are all negotiable at the senior level.
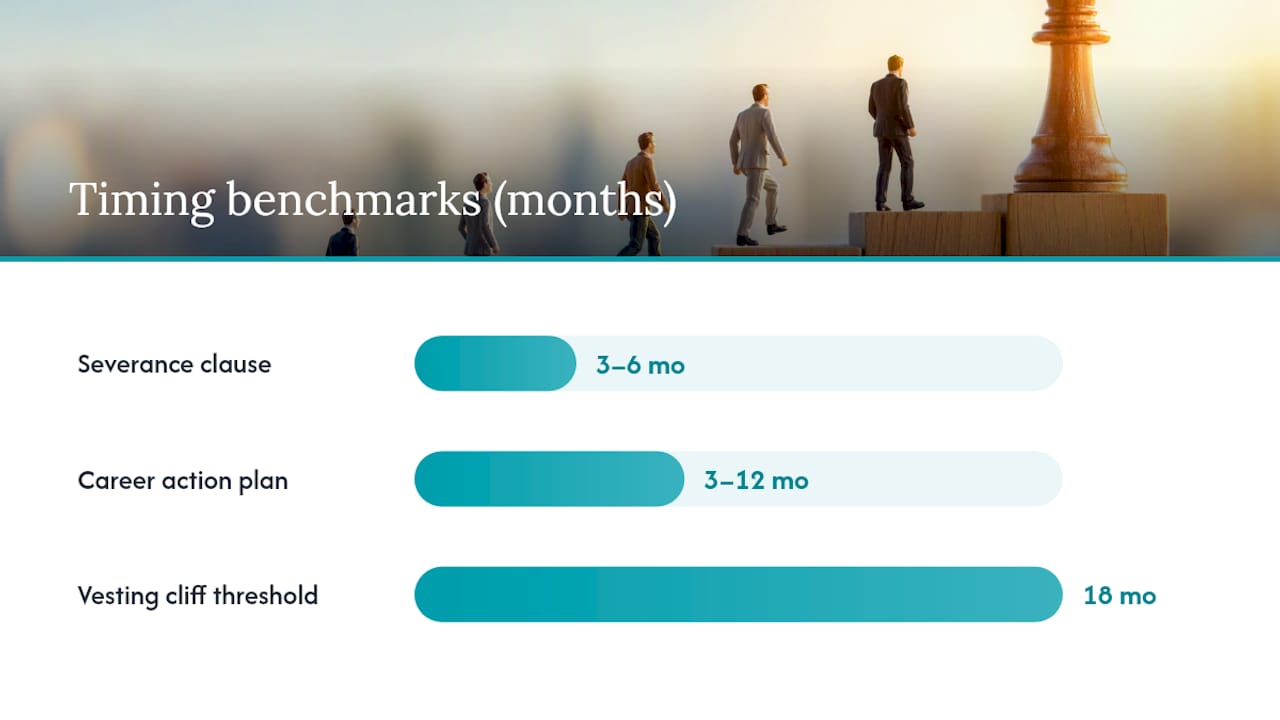
- Request severance language. Standard mid-level offers rarely include severance. Once you’re at director level or above, a severance clause (typically three to six months) is reasonable to request.
- Document your performance metrics explicitly. Tie your bonus and equity eligibility to specific, measurable outcomes you control. Vague performance criteria benefit the employer.
- Benchmark externally before every negotiation. Pull proxy statements for public companies in your industry. Use DOL occupational wage data. Know the market rate before you walk into the room.
Career moves vs. staying put: Switching companies typically unlocks a larger equity grant and a market-rate reset on base salary. Staying and earning a promotion often yields a smaller increment but preserves unvested equity. The math depends on how much unvested equity you’re leaving behind and what the new offer’s equity grant is worth at current valuation. Generally, if you’re more than 18 months from your next vesting cliff, the cost of leaving is lower.
Building credibility for executive-level pay requires visible scope expansion. Lead a P&L project. Manage a cross-functional initiative with measurable revenue or cost impact. Document outcomes in dollar terms, not activity terms. Compensation committees and hiring managers price scope, not effort.
A 3 to 12 month action plan:
- Pull the proxy statement for your target company or industry peers this week.
- Identify the gap between your current total compensation and the market rate for the next level up.
- Request a scope expansion or P&L responsibility in your next performance review conversation.
- Build an external benchmark file with three to five data points from proxy statements and DOL data.
- If you’re job searching, engage a career coach or executive resume writer to position your scope and outcomes correctly before you apply.
Pro Tip: Time your compensation ask around your company’s fiscal year-end or a major funding event. Compensation committees set budgets at the start of the fiscal year, and equity pools are often allocated in Q1. Asking in Q3 means you’re competing for what’s left.
Research spotlight: how organizational structure widens pay disparities
The pay gap between executives and mid-level professionals isn’t just a market phenomenon. Academic research points to structural and governance factors that shape pay allocation across organizational layers in ways that individual negotiation can’t fully overcome.
Research published in SAGE journals finds that organizational structure and layers of monitoring materially influence incentive-pay size. Division directors in large, diversified firms often receive smaller incentive pay than CEOs of smaller firms, because tighter monitoring and overlapping P&L responsibilities reduce the marginal value of incentive contracts. The implication: the same functional role yields different incentive pay depending on where it sits in the hierarchy and how much independent decision-making authority it carries.
Oxford Economic Papers research extends this by analyzing counterintuitive pay-structure patterns across managerial layers, finding that non-economic frictions and firm practices shape pay allocation in ways that standard market-clearing models don’t fully predict. Governance structures, internal politics, and historical pay precedents all leave fingerprints on who gets what.
The DOL/CTOT study on mid-level occupations finds that Black entrants to mid-level occupations earned $3.07 per hour less in 10-year wage growth than comparable White entrants, and women earned $3.61 per hour less than men in comparable cohorts, gaps that persist even after controlling for occupation and entry characteristics.
Those figures matter for two reasons. First, they show that mid-level wage growth is not uniform even within the same occupational category. Second, they suggest that the structural factors widening executive-to-worker pay gaps also operate within mid-level roles, compounding over a career.
The methodological note worth keeping in mind: the CTOT study uses a cohort-follow observational design, which captures wage trajectories but cannot fully isolate causation. The SAGE and Oxford findings are similarly observational. What the body of research establishes is a consistent pattern: organizational structure, governance design, and demographic factors all shape pay outcomes in ways that go beyond individual performance or market supply and demand.
For employers and policy researchers, the takeaway is that pay equity interventions at the mid-level matter as much as executive pay reform. For individual professionals, the takeaway is more direct: your pay trajectory is partly structural, which means changing your structural position (your scope, your reporting line, your company tier) often matters more than negotiating harder within your current role.
What I’ve seen working with executives and mid-level professionals
Most mid-level professionals underestimate how much of the executive pay gap is structural rather than personal. They assume executives earn more because they’re more talented or more experienced. Sometimes that’s true. More often, it’s because executives negotiated a different type of contract, sit in a role with independent P&L authority, and receive equity that compounds over years of stock appreciation.
What I’ve observed consistently is that the professionals who close the gap fastest are the ones who reframe the conversation. They stop asking for a raise and start asking for a different compensation structure: equity, a performance bonus tied to specific outcomes, and severance language. Those asks signal executive-level thinking, and they often unlock a different category of offer.
The structure changed. That’s the lever.
The research backs this up. Organizational structure shapes incentive pay. Peer-group benchmarking escalates executive pay over time. Equity compounds. None of those mechanisms work in your favor if you stay in a role that doesn’t include them. The most important career move is often the one that gets you into a compensation structure, not just a higher salary band.
Resumewiz can help you position for equity-bearing roles
Knowing why executive compensation differs from mid-level pay is one thing. Positioning yourself to capture that upside is another. That’s where the work actually happens.

Resumewiz works with mid-level professionals and executives who are ready to move into roles with equity, P&L responsibility, and compensation structures that reflect their actual scope. The services are built for this exact transition: executive resume writing that quantifies your decision-making impact in dollar terms, LinkedIn optimization that signals leadership scope to recruiters and compensation committees, and salary negotiation coaching that prepares you to ask for equity, severance, and performance-linked bonuses with confidence.
In a single week of coaching, you can walk away with a negotiation-ready talking points document, a benchmarked compensation target based on proxy data and market rates, and a resume that positions your scope correctly for the next level. Paid career services make the most sense when you’re moving into a role where the compensation difference between a well-positioned ask and a poorly positioned one is $30,000 or more in total comp. At the director level and above, that gap is almost always real.
If you’re ready to move from a salary-only structure to one that includes equity and performance pay, start with Resumewiz.
Primary sources and where to verify the data
These are the primary documents and datasets behind the claims in this article. Each one is publicly accessible.
SEC proxy statements (Form DEF 14A) are the most direct source for individual executive pay at any U.S. public company. Search the SEC’s EDGAR database (sec.gov/cgi-bin/browse-edgar) by company name, filter for DEF 14A filings, and look for the Summary Compensation Table under Item 402. It shows base salary, bonus, stock awards, option awards, and total compensation for each Named Executive Officer for the past three fiscal years.
EPI’s CEO pay analysis provides trend data and methodology notes on CEO-to-worker pay ratios over time. Use it for historical context and to understand why single-year figures can be misleading due to equity volatility.
FRED’s compensation data series at the St. Louis Fed holds macro wage and compensation indexes. Search for “employment cost index” or “compensation of employees” to find time-series data useful for cross-checking whether executive pay growth tracks broader wage trends.
DOL/CTOT study on mid-level occupations documents wage growth disparities by gender and race/ethnicity among entrants to the same occupational categories. Useful for understanding career-path wage dynamics below the executive level.
Academic sources: The SAGE journal article on organizational structure and incentive pay and the Oxford Economic Papers article on pay-structure patterns explain the structural and governance mechanisms behind pay allocation. The NBER paper on CEO compensation provides economic and sociological analysis of the drivers behind high executive pay.
Compensation Authority’s overview at compensationauthority.com explains pay components, SEC disclosure rules, and pay-mix benchmarks for S&P 500 executives in accessible terms. Use it as a starting reference before going deeper into proxy filings.
For any specific company, the proxy statement is your most reliable source. Everything else provides context. The proxy gives you the actual numbers.
Want a recruiter in your corner for your next senior role? Book a free call with Resume Wiz and we will map out your next move together.
Sources
- Wage Growth Disparities by Gender and Race/Ethnicity Among Entrants to Mid-Level Occupations (CTOT Study)
- CEO pay, Economic Policy Institute (EPI)
- Executive compensation: Structure, components, and standards | Compensation Authority
- Executive compensation, The Balance
- NBER lecture/paper on CEO compensation
- Academic article on pay-structure and incentive allocation (Oxford Economic Papers DOI)
- FRED: Compensation and CEO pay related data categories
